The tidal calendar is an essential support on many points of the coast. It brings together complete and official tidal prediction information for a geographically defined tidal area.
There are displayed the times and heights of high water, the times and heights of low water, the origin of the data, the name of the reference port… and in France the tide coefficients. It allows you to know and visualize a tide year at a glance.
“Simplify the tides, follow the curve!”
Check the origin of the data used and the year
On a tidal calendar start by checking the proposed tidal area. Which port is used to make the schedule? The reference port is specified at the bottom of our calendar, for example BREST or CONCARNEAU or ARCACHON., as well as the official origin of the data and our reproduction authorization number. Also always check that you are viewing the predictions for the current year.

Check the units of time and measurement
Most tidal calendars are offered in legal hours. They take into account the time changes between summer and winter. However, in some countries, hour corrections are not offered directly. Our tidal calendars are all offered in legal hours.
Concerning the heights of water we use meters. Depending on the country where you are, consult the unit of measurement used.
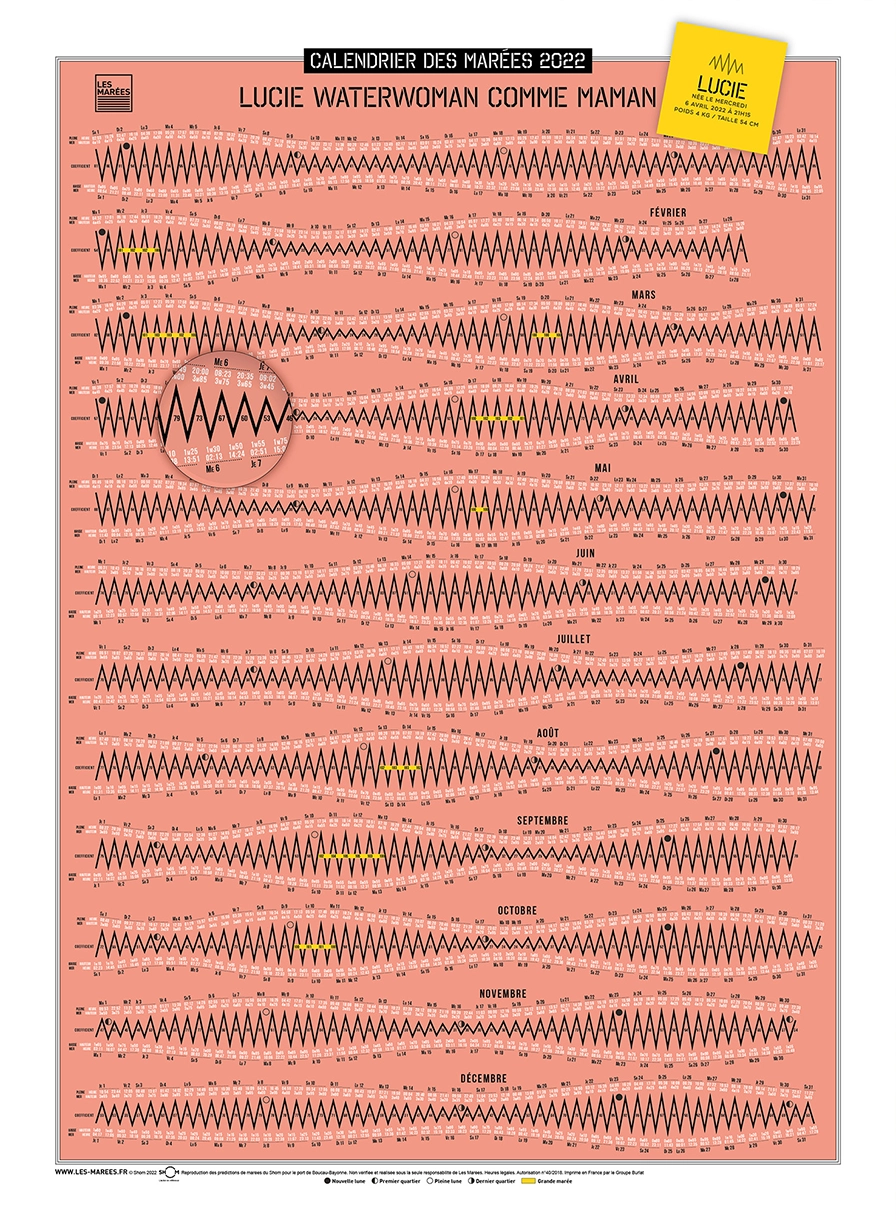
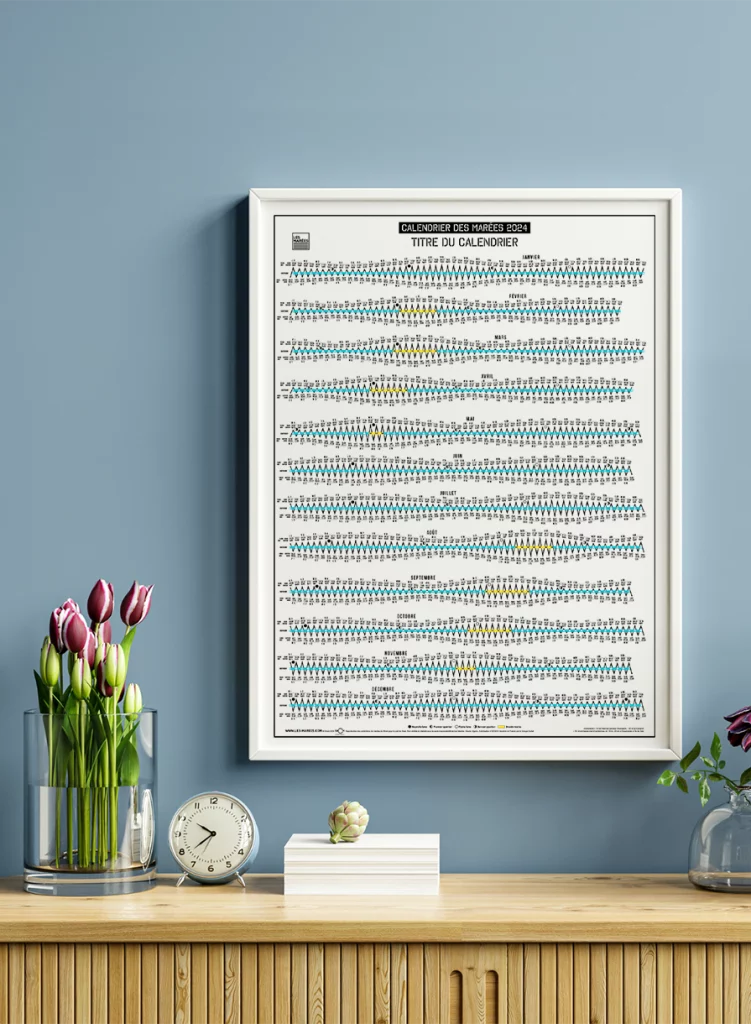
The overall presentation of the tidal calendar
A year of predictions for a coastal area. Each tide zone has its own schedule, times and heights are specific to a tide zone.
A curve drawn for each month of the year, i.e. 12 curves on our illustrations.
- Reading from top to bottom:
- TIDES CALENDAR 2024 (reference year)
- The custom title you want: CALENDAR TITLE
- Time markers: days, dates and months.
- The figures for the hours and heights of high tide or high tide
- The January curve
- The phases of the moon in the curve.
- The figures for the hours and heights of low tide or low tide
- The following months
- Moon phase guide
- The reference of the data provider and the mention of the port used to draw the calendar, our license fee and possibly information on the time corrections to be made within the tidal zone.
On the tide chart for Paimpol-Bréhat, these are the tide times for Paimpol (tidal zone guide)
Concerning the Island of Oléron, these are the tide times of La Rochelle – La Pallice (reference port). No time corrections.
In France you also find the tide coefficients positioned in the middle of each curve and the high tides marked with a yellow bar.
In England we also highlight kings tides with a yellow bar. This is the same curve less coefficients.
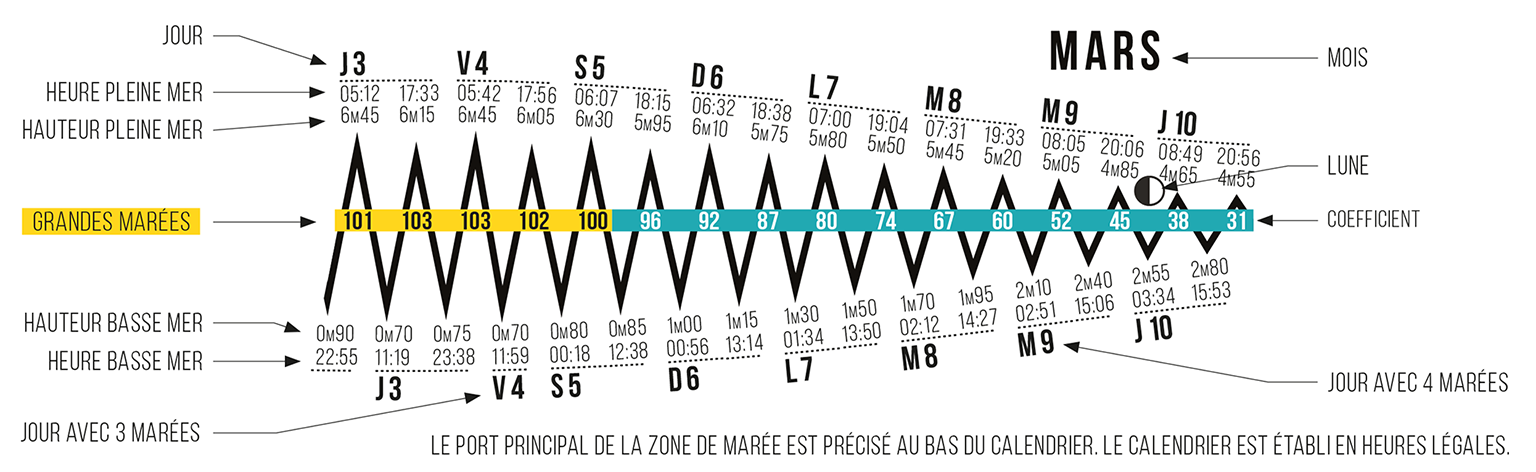
Four tides a day in France and Europe
Every day there are 2 high tides and 2 low tides, i.e. 4 extremums.
High tide times and high tide heights (high tides) are located above the curve and connected by dotted lines.
Low water times and low water heights (low tides) are located below the curve and connected by dotted lines.
The dotted lines allow you to clearly read and link the data from the same day. Long dotted lines for the 2 high tides and 2 low tides daily.
Sometimes three tides a day. The exception of semi-diurnal tides
About four times a month the dotted lines are shorter because there is only one high tide or one low tide during the day.
Twice a month there is only one high tide.
Twice a month there is only low tide.
Tidal coefficients positioned on the curve
French coast only.
They tell us about the tidal range, that is to say the importance of the rise and fall of the water or the difference in altitude between a low tide and a successive high tide!
At full moon and new moon, it is a period of spring water (coefficients from 70 to 120), the water rises a lot and falls a lot. The tidal range is important.
In the first and last quarter, it is a period of neap tide (coefficients below 70), the water rises and falls little. The tidal range is low.
These 2 periods alternate regularly from one week to the next following the rhythm of the lunar phases.
We will devote a complete article to the concept of coefficient. A french concept 🙂
The curves are proportional to the tidal coefficients or heights
The curve is wide, the coefficient and the tidal range are high: spring water
The curve is narrow, the coefficient and the tidal range are low: dead water
At a glance we know which period we are in: Quick Water or Dead Water.
High tides highlighted
As these are key moments on the coast, we mark them with yellow bars that are recognizable at first glance.
The high tides are positioned on the widest curves during the new moon or full moon period.
According to the SHOM convention, high tide is the moment when the coefficient is equal to or greater than 100.
On the tidal charts in England and Portugal we also show these high tides (Spring tides or Royal tides) with a yellow bar. We decide from which tidal range we carry the yellow bars and we indicate it at the bottom of the calendar.
A lunar calendar
It is impossible to carry out this tide calendar without highlighting the preponderant role played by the moon on the perpetual movement of ebb and flow of the waters!
This calendar is a lunar calendar with the clearly visible phases of the moon which impose their rhythm and the periods.
![]()
The 4 major aspects that punctuate the tides
The tides are astronomical and can be predicted well in advance. This is celestial mechanics in operation.
The tides are mathematical, they can be calculated, universal calculation formulas have been put in place, in particular that of the tidal coefficient.
The tides are geographical because each area has its own particularities which will influence the movement of water. The bays, the points, the coastline, the depth of the water…
The tides are meteorological, low atmospheric pressure, a strong wind with an “offshore” or “onshore” direction will upset the predicted water levels.
“the tides are not only due to the attraction of the moon and the real time between high water and low water is not 6 hours, it’s not that simple!” Odile Guérin conference on tides in Capbreton
Our data provider partners
We are partners of SHOM, UKHO and BSH in this regard; we benefit from a license to use this rigorous data which cannot be reproduced without prior authorization. The license number is printed on each calendar.
Our work is a creative work which cannot be used or reproduced without our authorization ©
In conclusion
The tide chart is the companion of surfers, fishermen, sailors and all economic players on a coastline. It is important to be aware of it for security reasons as well. The rising waters can be rapid and you may find yourself surrounded by water or trapped at the foot of a cliff.
We hope this article “how to read the tide calendar” has helped you! Watch the video that explains the natural phenomenon of tides.
Tidal calendar 60 x 80 cm for french coast
To compare French, German and English calendars see reading instructions.
Par Béatrice LABORDE créatrice des marées